Showing posts with label albedo. Show all posts

Sea ice is shrinking


Arctic sea ice extent fell 0.16 million km² from November 16 to November 19, 2016, as illustrated by above ads.nipr.ac.jp/vishop image. The image below, based on NSIDC data, shows the Arctic sea ice shrinking 49,000 km² in four days.


This is happening at a time when there is little or no sunlight reaching the Arctic, as illustrated by the image below.


The image below was created by Torstein Viddal and earlier posted at the Arctic Sea Ice Collapse blog.


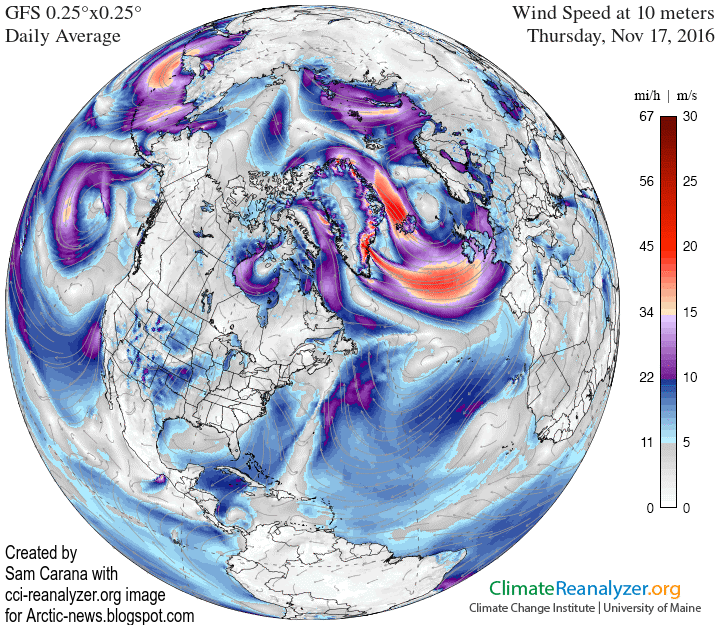
This recent fall in extent is partly due to strong winds, as illustrated by the image on the right.

Mostly, though, the lack of sea ice over the Arctic Ocean is caused by very warm water that is now arriving in the Arctic Ocean.

During the northern summer, water off the coast of North America warms up and gets pushed by the Coriolis force toward the Arctic Ocean. It takes several months for the water to travel along the Gulf Stream through the North Atlantic.

It has taken until now for the Arctic Ocean to bear the brunt of this heat.

As the image below shows, record sea surface anomalies showed up near Svalbard on October 31, 2016, when this heat first arrived in the Arctic.


On October 31, 2016, the Arctic Ocean was as warm as 17°C or 62.7°F (green circle near Svalbard), or 13.9°C or 25°F warmer than 1981-2011. This indicates how much warmer the water is beneath the surface, as it arrives in the Arctic Ocean from the Atlantic Ocean.

Moreover, Antarctic sea ice is also falling, reflecting the warming of oceans globally. For some time now, Antarctic sea ice extent has been at a record low for the time of the year.  On November 19, 2016, the combined extent of Arctic and Antarctic sea ice was 22.423 million km², as the image below shows.


This constitutes a fall in global sea ice extent of 1.085 million km² (418,900 square miles) since November 12, 2016, when global sea ice extent was 23.508 million km².

Let's look at those figures again. On Saturday November 12, 2016, global sea ice extent was 23.508 million km². On Saturday November 19, 2016, global sea ice extent was 22.423 million km². That's a fall of more than one million km² in one week.

By comparison, that's more than the combined size of ten European nations (such as Switzerland, Austria, Hungary, Germany, Denmark, the Netherlands, Belgium, Luxembourg, the United Kingdom and Ireland).

Or, it's more than the combined size of seventeen States of the United States (such as Ohio, Virginia, Tennessee, Kentucky, Indiana, Maine, South Carolina, West Virginia, Maryland, Hawaii, Massachusetts, Vermont, New Hampshire, New Jersey, Connecticut, Delaware and Rhode Island).

How much additional energy does Earth retain, due to such an albedo change? If it was a total albedo flip, it would be some 0.68 W/m². A conservative estimate would be a 50% albedo flip, as the image below illustrates, so this would mean that Earth now retains some 0.34 W/m² extra energy.

Thick sea ice covered with snow can reflect as much as 90% of the incoming solar radiation. After the snow begins to melt, and because shallow melt ponds have an albedo (or reflectivity) of approximately 0.2 to 0.4, the surface albedo drops to about 0.75. As melt ponds grow and deepen, the surface albedo can drop to 0.15, while the ocean reflects only 6% of the incoming solar radiation and absorbs the rest.


So, this one-week fall in sea ice extent means there now is an additional warming of some 0.34 W/m². By comparison, the warming impact relative to the year 1750 of all carbon dioxide emitted by people was 1.68 W/m² in the most recent IPCC assessment report (AR5).

There's more! As sea ice declines, there is not only albedo loss due to a fall in extent, but there is also albedo loss over the remaining sea ice, which turns darker as it melts.

The image below shows the fall in extent of Antarctic sea ice up to November 20, 2016. On November 20, 2016, Antarctic sea ice extent was 2.523 million km² less than its extent was at the same time of the year in 2015.


How much more energy is now retained by Earth than in 2015? Assuming a 50% albedo flip for this extent loss and a similar albedo loss that's taking place over the remaining ice, this means that Earth is now retaining an extra amount of energy (compared to 2015) that is equal to all the warming relative to pre-industrial due to carbon dioxide emitted by people.

Above image shows how the difference between 2016 and 2015 Antarctic sea ice extent grew between November 4 and November 23. On November 23, 2016, Antarctic sea ice extent was 2.615 million km² smaller than on November 23, 2015.

That means that a huge amount of sunlight is now absorbed by the ocean, rather than reflected back into space.

The animation on the right (added later) shows the decline of the sea ice around Antarctica over the period from November 16, 2016, to January 4, 2017. For comparison, the blue line shows the 1979-2000 average.

The situation is dire and calls for comprehensive and effective action as described in the Climate Plan.


The Threat Of Arctic Albedo Change

Arctic sea ice extent in 2016 was the lowest since satellite measurements started, when extent is averaged over the period from March 20 to September 22, as illustrated by the image below.


As the added trend also illustrates, this decline in Arctic sea ice extent looks set to further accelerate and result in a dramatic fall in albedo. The trend points at zero sea ice over this entire period in less than two decades from now.

Zero sea ice on a single day looks set to occur much earlier; a similar trend points at minimum sea ice extent reaching zero in about a decade from now, as illustrated by the image below.

Above image also shows average sea ice extent data for the period January 1 to September 22, i.e. the year to date (blue line). The added trend points at zero being reached in 2037. The data show that Arctic sea ice extent also was the lowest since satellite measurements started, when extent is averaged over the period from January 1 to September 22.

Finally, the image also shows data for the average sea ice extent over the entire year. Data for 2016 are not available yet, but it does look like 2016 will also be have the lowest sea ice extent when averaged over the entire year.

Anyway, the period between the equinoxes of March 20 and September 22/23 is most important, as the Arctic receives most sunlight during this period. This is illustrated by the image on the right and by he image below, from an earlier post, which further shows that the amount of solar radiation received by the Arctic at the time of the June Solstice is higher than anywhere else on Earth.


Thick sea ice covered with snow can reflect as much as 90% of the incoming solar radiation. After the snow begins to melt, and because shallow melt ponds have an albedo (or reflectivity) of approximately 0.2 to 0.4, the surface albedo drops to about 0.75. As melt ponds grow and deepen, the surface albedo can drop to 0.15, while the ocean reflects only 6% of the incoming solar radiation and absorbs the rest.


As Professor Peter Wadhams, University of Cambridge, once calculated, a collapse of the sea ice would go hand in hand with dramatic loss of snow and ice cover on land in the Arctic. The albedo change resulting from the snowline retreat on land is similarly large as the retreat of sea ice, so the combined impact could be well over 2 W/sq m. To put this in context, albedo changes in the Arctic alone could more than double the net radiative forcing resulting from the emissions caused by all people of the world, estimated by the IPCC to be 1.6 W/sq m in 2007 and 2.29 W/sq m in 2013.

Professor Peter Wadhams on albedo changes in the Arctic
Collapse of the sea ice could occur even faster than decline of sea ice extent may indicate.

Rapid loss of sea ice thickness has taken place over the years, as discussed in a recent post. A trend based on PIOMAS volume data (preliminary for 2016) points at a collapse around December 2021/January 2022, as illustrated by the graph below.

Indeed, Professor Peter Wadhams warned about this in 2012: "global warming will increase the intensity of extreme weather events, so more heavy winds and more intense storms can be expected to increasingly break up the remaining ice, both mechanically and by enhancing ocean heat transfer to the under-ice surface."

Thin sea ice is more vulnerable to the stronger storms that can be expected to hit the Arctic Ocean during the northern summer more frequently, and they could push huge amounts of ice out of the Arctic Ocean.


The sea ice acts as a heat buffer by absorbing energy in the process of melting. In other words, as long as there is sea ice, it will absorb heat and this will prevent this heat from raising the temperature of the water in the Arctic. Once the sea ice is gone, this latent heat must go elsewhere.

As the sea ice heats up, 2.06 J/g of heat goes into every degree Celsius that the temperature of the ice rises. While the ice is melting, all energy (at 334J/g) goes into changing ice into water and the temperature remains at 0°C (273.15K, 32°F).

Once all ice has turned into water, all subsequent heat goes into heating up the water, at 4.18 J/g for every degree Celsius that the temperature of water rises.

The amount of energy absorbed by melting ice is as much as it takes to heat an equivalent mass of water from zero to 80°C. The energy required to melt a volume of ice can raise the temperature of the same volume of rock by 150º C.
This buffer is now largely gone and further decline of Arctic sea ice means that a lot more heat will be absorbed by the Arctic.

As the water of the Arctic Ocean keeps warming, the risk increases that methane hydrates at the bottom of the Arctic Ocean will destabilize. Increases in temperature due to albedo changes and methane releases in the Arctic will go hand in hand with further feedbacks, in particular increased levels of water vapor in the atmosphere.

Here's the danger: As decline of the snow and ice cover in the Arctic continues and as more methane gets released from the seafloor, temperatures will rise rapidly, triggering further feedbacks such as a rise of water vapor in the atmosphere. Keep in mind that what makes heat unbearable is a combination of high temperatures with high humidity levels. Furthermore, water vapor is a potent greenhouse gas that will further accelerate the temperature rise. Taken together, we are facing the possibility of a 10°C temperature rise within one decade.

The image below, from the extinction page, shows that we may well be on a trend that is rising even faster than the rapid temperature increases in 2016 may indicate. Indeed, a large part of global warming is currently masked by aerosols and, as we make progress with the necessary shift to clean energy, the full wrath of global warming looks set to become manifest soon.


Risk is the product of probability and severity. The risk of a 10°C temperature rise is incalculably high. On the severity dimension, the impact of such a temperature rise is beyond catastrophic, i.e. we're talking about extinction of species at massive scale, including humans. On the probability dimension, this outcome appears to be inevitable if no comprehensive and effective action is taken.


Above danger assessment adds a third dimension, i.e. timescale. A 10°C temperature rise could eventuate within one decade and this also makes the danger imminent, adding further weight to the need to start taking comprehensive and effective action, as described in the Climate Plan.


Storms over Arctic Ocean


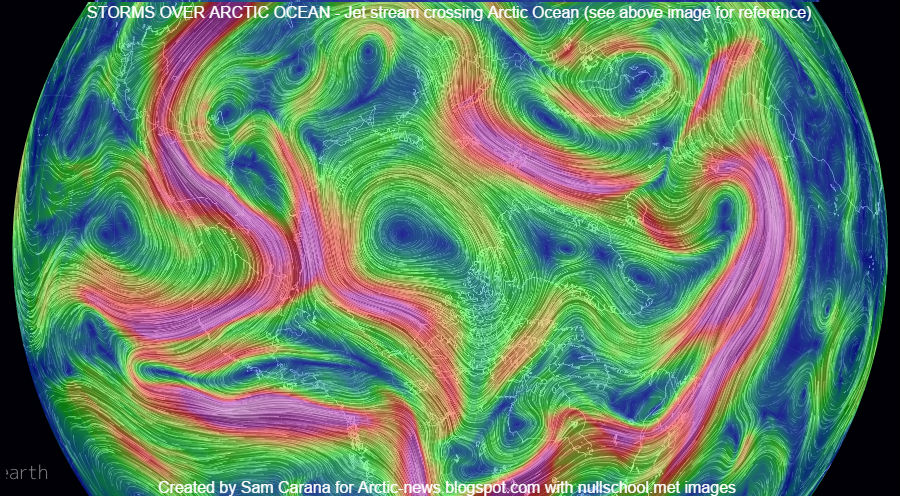
Winds over the Arctic Ocean reached speeds of up to 32 mph or 52 km/h on August 19, 2016. The image below shows the Jet Stream crossing Arctic Ocean on August 19, 2016 (see map on above image for geographic reference).


The Naval Research Lab image on the right shows a forecast for sea ice speed and drift run on August 15, 2016, and valid for August 17, 2016.

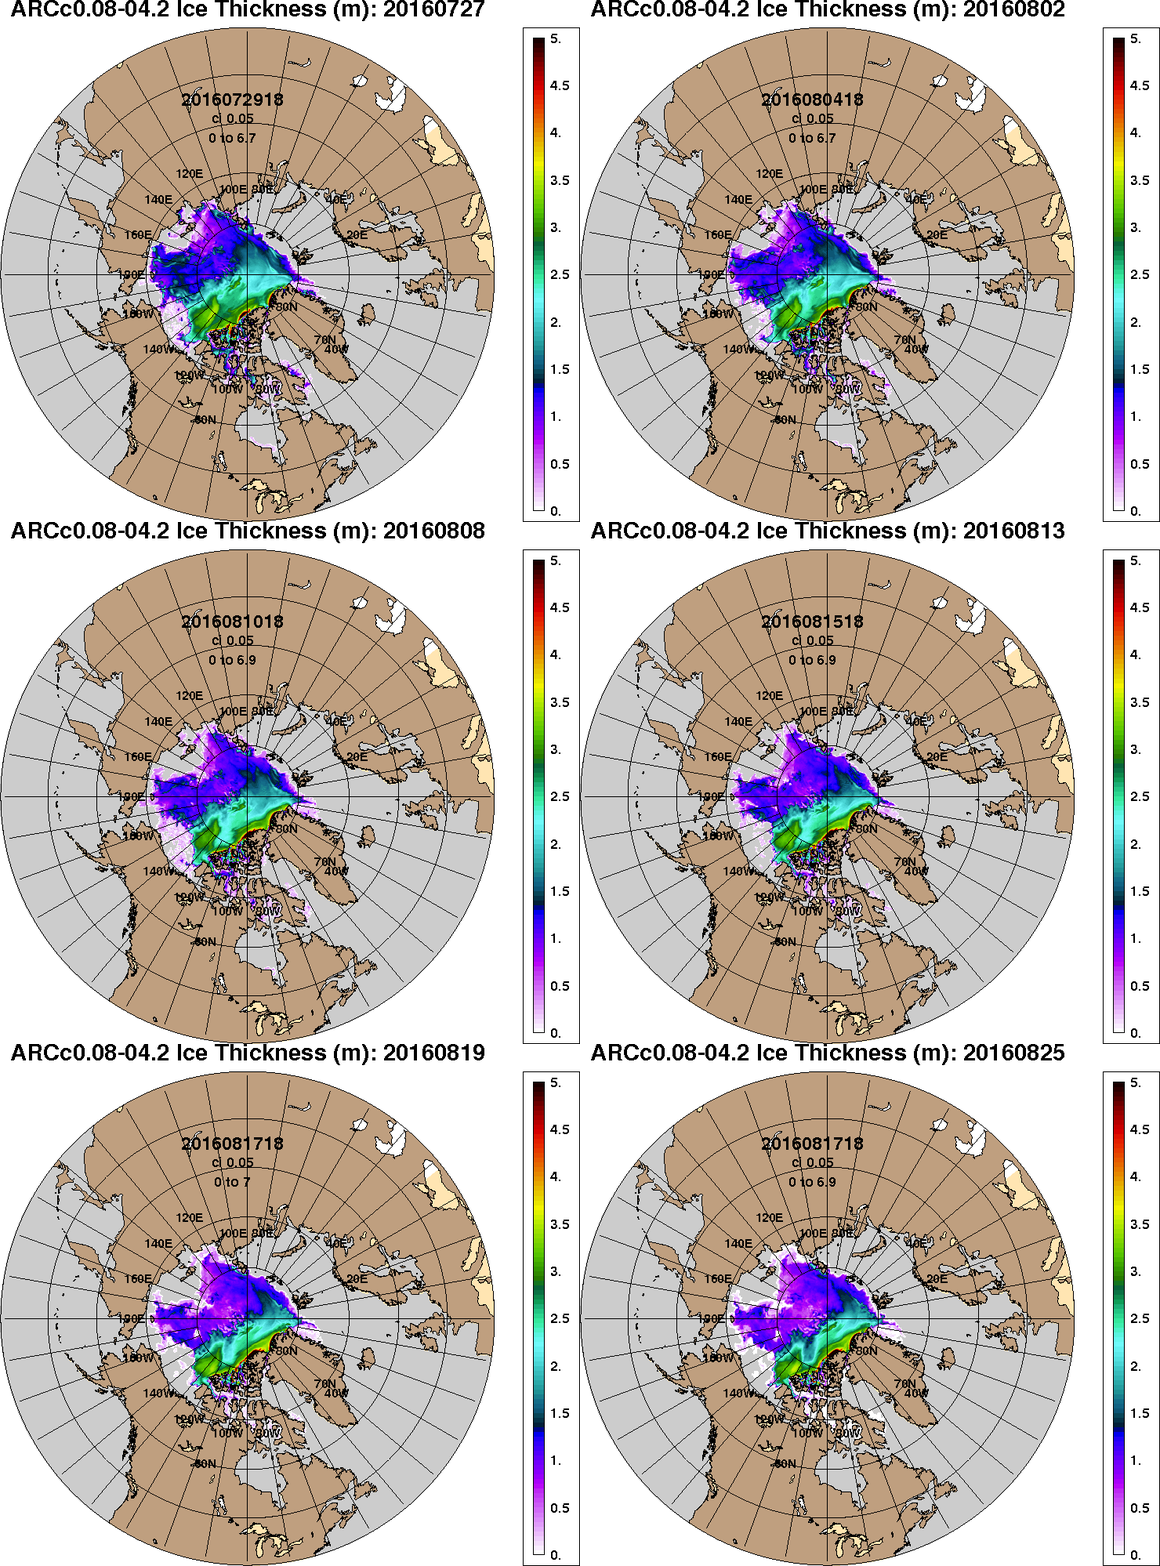
These storms come at a time when the sea ice has become extremely thin, as illustrated by the Naval Research Lab sea ice thickness animation below, covering a 30-day period run on August 17, 2016, with a forecast through to August 25, 2016. The animation shows that the multi-year sea ice has now virtually disappeared.

With the sea ice in such a bad shape, strong winds can cause a rapid drop in sea ice extent, at a time when the Arctic still has quite a bit of insolation. At the North Pole, insolation will come down to zero at the time of the September 2016 Equinox.


Even more terrifying is the Naval Research Lab's Arctic sea ice thickness forecast for August 25, 2016, run on August 17, 2016, using a new Hycom model, as shown on the right.

With the thicker multi-year sea ice now virtually gone, the remaining sea ice is prone to fracture and to become slushy, which also makes it darker in color and thus prone to absorb more sunlight.

Furthermore, if strong winds keep hitting the Arctic Ocean over the next few weeks, this could push much of the sea ice out of the Arctic Ocean, along the edges of Greenland and into the Atlantic Ocean.
Strong winds are forecast to keep hitting the Arctic Ocean hard for the next week, as illustrated by the image on the right showing a forecast for August 24, 2016.

As sea ice extent falls, less sunlight gets reflected back into space and is instead absorbed by the Arctic. Once the sea ice is gone, this can contribute to a rapid rise in temperature of the surface waters.

The video below shows cci-reanalyzer.org wind speed at 10 meters forecasts from August 25, 2016 1800 UTC to September 2, 2016 0300 UTC.


The left panel on the image below shows winds (surface) reaching speeds as high as 61 km/h or 38 mph over the Arctic Ocean (green circle), while the right panel shows winds at 250 hPa (jet stream).


As the Arctic warms faster than the rest of the world, the temperature difference between the Equator and the Arctic decreases, slowing down the speed at which the Northern Polar Jet Stream circumnavigates Earth, and making it wavier.

As a result, the Jet Stream can extend far over North America and Eurasia, enabling cold air to move more easily out of the Arctic (e.g. deep into Siberia) and at the same time enabling warm air to move more easily into the Arctic (e.g. from the Pacific Ocean). Such changes to the jet stream also enable strong winds to cross East Siberia more easily and cause stormy weather over the Arctic Ocean.

This is illustrated by the image below. The left panel shows the jet stream crossing East Siberia at speeds as high as 277 km/h or 172 mph on August 27, 2016, while at surface level cyclonic winds occurring over the Arctic ocean reached speeds as high as 78 km/h or 48 mph that day.

The right panel shows that, on that day, cold air moved deep into Central Siberia, resulting in temperatures as lows as -15.9°C or 3.5°F in Central Siberia and temperatures that were higher than they used to be over the Arctic Ocean.


[ click on image to enlarge ]
The image on the right shows surface winds (top) and winds at 250 hPa (i.e. jet stream, bottom) over the Arctic Ocean causing snow (blue) and rain (green) to fall north of Greenland (center).

Rain can have a devastating impact on the sea ice, due to kinetic energy breaking up the ice as it gets hit.

This can fragment the ice, resulting in water that is warmer than the ice to melt it both at the top and at the sides, in addition to melting that occurs at the bottom due to ocean heat warming the ice from below and melting that occurs at the top due to sunlight warming the ice from above.

Furthermore, where the rainwater stays on top of the sea ice, pools of water will form, fed by rainwater and meltwater. This will darken the surface. Melting sea ice is also darker in color and, where sea ice melts away altogether, even darker water will emerge. As a result, less sunlight is getting reflected back into space and more sunlight is instead absorbed.

The image below shows Arctic sea ice thickness (in m, nowcast, run on August 27, 2016, valid for August 28, 2016, panel left) and Arctic sea ice speed and drift (in cm per second, nowcast, run on August 27, 2016, valid for August 28, 2016, panel right).


The danger is that such storms, especially at this time of year, can push much sea ice out of the Arctic Ocean, along the edges of Greenland, into the Atlantic Ocean.


This danger grows as the sea ice gets thinner. Above image shows ice thickness (in m) nowcasts, run on August 30 and valid for August 31, for each year from 2012 to 2016.


Next to loss of snow and ice cover, another big danger in the Arctic is methane releases.

Above image shows methane levels as high as 2454 ppb on August 25, 2016 (top panel), strong releases from Alaska to Greenland on August 26, 2016 (middle panel), and mean methane levels as high as 1862 ppb on August 27, 2016 (bottom panel).

The image on the right shows high methane levels recorded at Barrow, Alaska, up to August 30, 2016.

The image below shows cyclonic winds (center left) over the Arctic Ocean on August 22, 2016.


The image below shows how little sea ice was left at locations close to the North Pole on August 25, 2016.


[ click on images to enlarge ]
The image on the right shows that Arctic sea ice extent was 4.8 million square km on August 27, 2016, according to the NSIDC.

NOAA data show that the July 2016 global land and ocean temperature was 16.67°C or 62.01°F, the highest temperature for any month on record.

The image below on the right shows July sea surface temperature anomalies (compared to the 20th century average) on the Northern Hemisphere.

This ocean heat is now being carried by the Gulf Stream toward to Arctic Ocean.

Meanwhile, the cold sea surface area that was so pronounced over the North Atlantic in 2015, is getting overwhelmed by ocean heat.

This is illustrated by the image below showing sea surface temperature anomalies on August 27, 2015 (left panel) and on August 27, 2016 (right panel).


The image below shows sea surface temperature anomalies in the Arctic (latitude 60°N-90°N) compared to 1961-1990.


The Climate Reanalyzer image below also shows sea surface temperature anomalies August 16, 2016, this time compared to 1979-2000.


The image below, from an earlier post, shows sea surface temperature anomalies on August 12, 2016, in the left-hand panel, and sea surface temperature anomalies in the right-hand panel.

Sea surface temperature and anomaly. Anomalies from +1 to +2 degrees C are red, above that they turn yellow and white
Above image also shows that on August 12, 2016, sea surface temperatures near Svalbard (at the location marked by the green circle) were as high as 18.9°C or 65.9°F, an anomaly of 13.6°C or 24.4°F.

As said above, changes to the Jet Stream enable warm air to move more easily into the Arctic Ocean and cold air to move more easily out of the Arctic Ocean. Where seas are shallow, a surface temperature rise can quickly warm up water all the way down to the Arctic ocean seafloor, where it can destabilize methane hydrates contained in sediments.

This could make that huge amounts of methane get released from the seafloor. Given that many of the seas in Arctic are very shallow, much of this methane can enter the atmosphere without getting broken down in the water, resulting in huge additional warming, especially over the Arctic. As discussed in an earlier post, this could contribute to a global temperature rise of over 10°C or 18°F by the year 2026.

One of the people who has been warning about these dangers for many years is Professor Peter Wadhams, whose new book A Farewell to Ice was recently launched (256 pages, published September 1, 2016).

The situation is dire and calls for comprehensive and effective action, as discussed at the Climate Plan.


Links

 Wildfires in Russia's Far East
http://arctic-news.blogspot.com/2016/08/wildfires-in-russias-far-east.html

 Climate Plan
http://arctic-news.blogspot.com/p/climateplan.html

 Rain Storms Devastate Arctic Ice And Glaciers 
http://arctic-news.blogspot.com/2015/01/rain-storms-devastate-arctic-ice-and-glaciers.html

 High Temperatures in the Arctic
http://arctic-news.blogspot.com/2015/06/high-temperatures-in-the-arctic.html

 Arctic Sea Ice Getting Terribly Thin
http://arctic-news.blogspot.com/2016/08/arctic-sea-ice-getting-terribly-thin.html

 A Global Temperature Rise Of More than Ten Degrees Celsius By 2026?
http://arctic-news.blogspot.com/2016/07/a-global-temperature-rise-of-more-than-ten-degrees-celsius-by-2026.html

 A Farewell to Ice, by Peter Wadhams
https://www.penguin.co.uk/books/273799/a-farewell-to-ice/9780241009420


A Global Temperature Rise Of More than Ten Degrees Celsius By 2026?

How much have temperatures risen and how much additional warming could eventuate over the next decade? The image on the right shows a potential global temperature rise by 2026 from pre-industrial levels. This rise contains a number of elements, as discussed below from the top down.

February 2016 rise from 1900 (1.62°C)

The magenta element at the top reflects the temperature rise since 1900. In February 2016, it was 1.62°C warmer compared to the year 1900, so that's a rise that has already manifested itself.

Rise from pre-industrial levels to 1900 (0.3°C)

Additional warming was caused by humans before 1900. Accordingly, the next (light blue) element from the top down uses 0.3°C warming to reflect anthropogenic warming from pre-industrial levels to the year 1900.

When also taking this warming into account, then it was 1.92°C (3.46°F) warmer in February 2016 than in pre-industrial times, as is also illustrated on the image below.


Warming from the other elements (described below) comes on top of the warming that was already achieved in February 2016.

Rise due to carbon dioxide from 2016 to 2026 (0.5°C)

The purple element reflects warming due to the amount of carbon dioxide in the atmosphere by 2026. While the IEA reported that energy-related carbon dioxide emissions had not risen over the past few years, carbon dioxide levels in the atmosphere have continued to rise, due to feedbacks that are kicking in, such as wildfires and reduced carbon sinks. Furthermore, maximum warming occurs about one decade after a carbon dioxide emission, so the full warming wrath of the carbon dioxide emissions over the past ten years is still to come. In conclusion, an extra 0.5°C warming by 2026 seems possible as long as carbon dioxide levels in the atmosphere and oceans remain high and as temperatures keep rising.

Removal of aerosols masking effect (2.5°C)

With dramatic cuts in emissions, there will also be a dramatic fall in aerosols that currently mask the full warming of greenhouse gases. From 1850 to 2010, anthropogenic aerosols brought about a decrease of ∼2.53 K, says a recent paper. While on the one hand not all of the aerosols masking effect may be removed over the next ten years, there now are a lot more aerosols than in 2010. A 2.5°C warming due to removal of part of the aerosols masking effect therefore seems well possible by the year 2026.

Albedo changes in the Arctic (1.6°C) 

Warming due to Arctic snow and ice loss may well exceed 2 W per square meter, i.e. it could more than double the net warming now caused by all emissions by people of the world, calculated Professor Peter Wadhams in 2012. A 1.6°C warming due to albedo changes (i.e. decline of both Arctic sea ice and snow and ice cover on land) therefore seems well possible by the year 2026.

Methane eruptions from the seafloor (1.1°C)

". . we consider release of up to 50 Gt of predicted amount of hydrate storage as highly possible for abrupt release at any time," Dr. Natalia Shakhova et al. wrote in a paper presented at EGU General Assembly 2008. Authors found that such a release would cause 1.3°C warming by 2100. Note that such warming from an extra 50 Gt of methane seems conservative when considering that there now is only some 5 Gt of methane in the atmosphere, and over a period of ten years this 5 Gt is already responsible for more warming than all the carbon dioxide emitted by people since the start of the industrial revolution. Professor Peter Wadhams co-authored a study that calculated that methane release from the seafloor of the Arctic Ocean could yield 0.6°C warming of the planet in 5 years (see video at earlier post). In conclusion, as temperatures keep rising, a 1.1°C warming due to methane releases from clathrates at the seafloor of the world's oceans seems well possible by the year 2026.

Extra water vapor feedback (2.1°C)

Rising temperatures will result in more water vapor in the atmosphere (7% more water vapor for every 1°C warming), further amplifying warming, since water vapor is a potent greenhouse gas. Extra water vapor will result from warming due to the above-mentioned albedo changes in the Arctic and methane releases from the seafloor that could strike within years and could result in huge warming in addition to the warming that is already there now. As the IPCC says: "Water vapour feedback acting alone approximately doubles the warming from what it would be for fixed water vapour. Furthermore, water vapour feedback acts to amplify other feedbacks in models, such as cloud feedback and ice albedo feedback. If cloud feedback is strongly positive, the water vapour feedback can lead to 3.5 times as much warming as would be the case if water vapour concentration were held fixed", according to the IPCC. Given a possible additional warming of 2.7°C due to just two elements, i.e. Arctic albedo changes and seafloor methane, an additional warming over the next decade of 2.1°C due to extra water vapor in the atmosphere therefore does seem well possible by the year 2026.

Further feedbacks (0.3°C)

Further feedbacks will result from interactions between the above elements. Additional water vapor in the atmosphere and extra energy trapped in the atmosphere will result in more intense storms and precipitation, flooding and lightning. Flooding can cause rapid decomposition of vegetation, resulting in strong methane releases. Furthermore, plumes above the anvils of severe storms can bring water vapor up into the stratosphere, contributing to the formation of cirrus clouds that trap a lot of heat that would otherwise be radiated away, from Earth into space. The number of lightning strikes can be expected to increase by about 12% for every 1°C of rise in global average air temperature. At 3-8 miles height, during the summer months, lightning activity increases NOx by as much as 90% and ozone by more than 30%. The combination of higher temperatures and more lightning will also cause more wildfires, resulting in emissions such as of methane and carbon monoxide. Ozone acts as a direct greenhouse gas, while ozone and carbon monoxide can both act to extend the lifetime of methane. Such feedbacks may well result in an additional 0.3°C warming by the year 2026.

Total potential global temperature rise by 2026 (10°C or 18°F)

Adding up all the warming associated with the above elements results in a total potential global temperature rise (land and ocean) of more than than 10°C or 18°F within a decade, i.e. by 2026. As said before, this scenario assumes that no geoengineering will take place over the next decade.

The situation is dire and calls for comprehensive and effective action as described in the Climate Plan.