Showing posts with label clathrates. Show all posts

Lake Baikal

The amount of methane stored in the form of hydrates at the bottom of Lake Baikal in Siberia is an estimated 1 trillion m³, which translates into 424 trillion kg of methane, or 424 Gt of methane. By comparison, the amount of methane in the atmosphere is about 5 Gt.


Aral Sea
Methane hydrates remain stable under a combination of sufficiently low temperatures and sufficiently high pressure. The temperature of the water at the bottom of the lake is about 3.5°C. This means that a large amount of water needs to remain present in the lake at any time, in order to keep the methane hydrates stable.

Lake Baikal is the world's deepest lake. Due to its depth, Lake Baikal is also the largest freshwater lake by volume in the world, containing roughly 20% of the world's unfrozen surface fresh water. Lake Baikal has 23,615.39 km³ (5,700 cu mi) of fresh water and a maximum depth of 1,642 m (5,387 ft).

If the water level in Lake Baikal were to fall, the pressure on the methane hydrates would decrease, resulting in huge methane eruptions, dwarfing the amount of methane currently in the atmosphere.

What are the chances that water levels in Lake Baikal will fall in future? The above animation shows the fate of the Aral Sea, further to the west in Asia (also on the map at top). The Aral Sea virtually disappeared over the course of the last few decades. Some people point at climate change as the cause. More people point at irrigation by farmers.
Yenisei River

Lake Baikal could go the same way. Climate change may well reduce the flow of the rivers that now feed Lake Baikal from Mongolia (image right). Furthermore, climate change may well reduce crop yields worldwide as well as the availability of fresh water, increasing temptations to use the water of Lake Baikal for irrigation.

Further decline of Arctic sea ice is likely to push up temperatures across Russia. The image below shows that temperatures as high as 36.6°C or 97.8°F were forecast for June 13, 2016, over the Yenisei River in Siberia that ends in the Arctic Ocean.
[ click on images to enlarge or go to original post ]
Even higher temperatures were recorded in 2015 at a location in Siberia well within the Arctic Circle.

Demands for water could increase even more dramatically due to wildfires and the need to fight such fires. The image below shows that on June 23, 2016, wildfires north of Lake Baikal caused emissions as high as 22,953 ppb CO and 549 ppm CO₂ at the location marked by the green circle.

[ click on images to enlarge or go to original post ]
The situation is dire and calls for comprehensive and effective action, as described at the Climate Plan.


Links

 Climate Plan
http://arctic-news.blogspot.com/p/climateplan.html

 Gone: endemic Baikal sponge has died completely in several areas of the vast lake
http://siberiantimes.com/ecology/casestudy/features/f0278-gone-endemic-baikal-sponge-has-died-completely-in-several-areas-of-the-vast-lake/

 Volume to weight conversion
http://www.aqua-calc.com/calculate/volume-to-weight

 Lake Baikal, Wikipedia
https://en.wikipedia.org/wiki/Lake_Baikal

 Aral Sea, Wikipedia
https://en.wikipedia.org/wiki/Aral_Sea

 Climate Feedbacks Start To Kick In More
http://arctic-news.blogspot.com/2016/06/climate-feebacks-start-to-kick-in-more.html

 High Temperatures In Arctic
http://arctic-news.blogspot.com/2016/06/high-temperatures-in-arctic.html

 East Siberian Heat Wave
http://arctic-news.blogspot.com/2015/07/east-siberian-heat-wave.html

 Wildfires in Russia's Far East
http://arctic-news.blogspot.com/2016/08/wildfires-in-russias-far-east.html


Seafloor Methane


Methane levels over the Arctic Ocean are higher than elsewhere on Earth. As the animation below shows, methane levels were as high as 2436 parts per billion (ppb) on the afternoon of December 5, 2016, with most methane rising up from the water, in particular over the Arctic Ocean.

Rise in the atmosphere of methane on December 5, 2016 (MetOp 1 pm), from 1000 mb, i.e. close to
sea level, up to a pressure of 586 mb, which corresponds with an altitude of 3833 m.

Methane levels over the Arctic Ocean have been high for more than a month. The video below, with a soundtrack by Daniel Kieve, shows methane levels from October 26, 2016 to November 25, 2016.


&nbsp

These high methane levels come at a time when there's hardly any sunlight reaching the Arctic, which pretty much rules out the possibility that algae blooms or other biological sources were causing these high methane levels. Instead, these high methane levels appear to be the result of methane eruptions from the seafloor of the Arctic Ocean, caused by warming water of the oceans.


Indeed, large quantities of methane appear to be erupting from seafloor of the Arctic Ocean and, as this methane rises in the atmosphere, it moves closer to the Equator, resulting in higher methane levels there as well. Above image further illustrates that seafloor methane appears to be pushing up mean global methane level at higher altitudes.

The image below shows the temperature rise of the oceans. Temperatures are rising particularly rapidly on the Northern Hemisphere.

[ Ocean warming, from earlier post ]
The huge amounts of energy entering the oceans translate into higher temperatures of the water and of the air over the water, as well as higher waves and stronger winds. Much of that heat is carried by the Coriolis force along the Gulf Stream from the coast of North America via the North Atlantic into the Arctic Ocean.

As the image on the right shows, sea surface temperatures near Svalbard (green circle) were as high as 14.1°C / 57.3°F on December 6, 2016, 12.1°C / 21.7°F warmer than in 1981-2011.

The rise in ocean heat is threatening to cause ever larger eruptions of methane from the seafloor.

As described at the Extinction page, methane eruptions from the seafloor could well cause a 1.1°C temperature rise over the next ten years, and in combination with other elements, this is threatening to cause global temperature to rise 10°C or 18°F by 2026.

The situation is dire and calls for comprehensive and effective action as described in the Climate Plan.


Links

• A pdf of the extinction page and an introduction to the Climate Plan can be downloaded from
https://sites.google.com/site/samcarana/climateplan/Climate-Plan-by-Sam-Carana.pdf?attredirects=0&d=1

 Climate Plan
https://arctic-news.blogspot.com/p/climateplan.html

 Methane
https://arctic-news.blogspot.com/p/methane.html

 Extinction
https://arctic-news.blogspot.com/p/extinction.html

 Old Mother Nature, by Daniel Kieve
https://soundcloud.com/danielkieve/old-mother-nature


High Methane Levels Follow Earthquake in Arctic Ocean

In the 12 months up to July 14, 2016, 48 earthquakes with a magnitude of 4 or higher on the Richter scale hit the map area of the image below, mostly at a depth of 10 km (6.214 miles).


As temperatures keep rising and as melting of glaciers keeps taking away weight from the surface of Greenland, isostatic rebound can increasingly trigger earthquakes around Greenland, and in particular on the faultline that crosses the Arctic Ocean.

Two earthquakes recently hit the Arctic Ocean. One earthquake hit with a magnitude of 4.5 on the Richter scale on July 9, 2016. The other earthquake hit with a magnitude of 4.7 on the Richter scale on July 12, 2016, at 00:15:24 UTC, with the epicenter at 81.626°N 2.315°W and at a depth of 10.0 km (6.214 miles), as illustrated by the image below.


Following that most recent earthquake, high levels of methane showed up in the atmosphere on July 15, 2016, over that very area where the earthquake hit, as illustrated by the image below.


Above image shows that methane levels were as high as 2505 ppb at an altitude of 4,116 m or 13,504 ft on the morning of July 15, 2016. At a higher altitude (of 6,041 m or 19,820 ft), methane levels as high as 2598 ppb were recorded that morning and the magenta-colored area east of the north-east point of Greenland (inset) looks much the same on the images in between those altitudes. All this indicates that the earthquake did cause destabilization of methane hydrates contained in sediments in that area.

Above image, from another satellite, confirms strong methane releases east of Greenland on the afternoon of July 14, 2016, while the image below shows high methane levels on July 16, 2016, along the faultline that crosses the Arctic Ocean.


The image on the right shows glaciers on Greenland and sea ice near Greenland and Svalbard on July 15, 2016. Note that clouds partly obscure the extent of the sea ice decline.


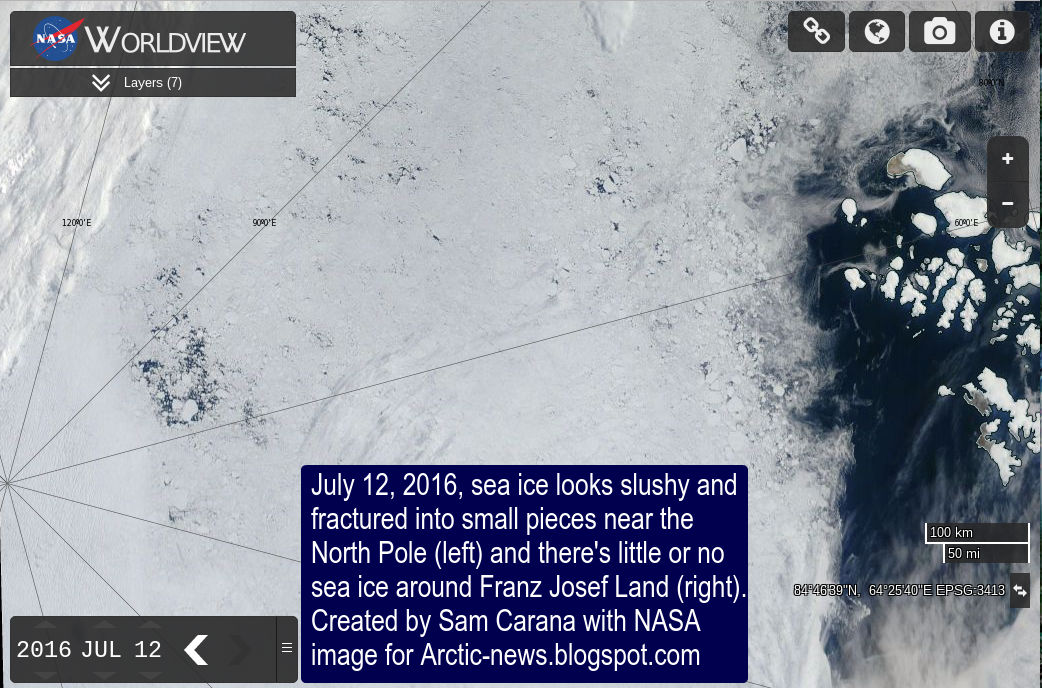
Above image shows the sea ice on July 12, 2016. There is a large area with very little sea ice close to the North Pole (left) and there is little or no sea ice around Franz Josef Land (right). Overall, sea ice looks slushy and fractured into tiny thin pieces. All this is an indication how warm the water is underneath the sea ice.

[ click on image to enlarge ]
In addition to the shocks and pressure changes caused by earthquakes, methane hydrate destabilization can be triggered by ocean heat reaching the seafloor of the Arctic Ocean. Once methane reaches the atmosphere, it can very rapidly raise local temperatures, further aggravating the situation.

Temperatures are already very high across the Arctic, as illustrated by the image below, showing that on July 16, 2016, it was 1.6°C or 34.8°F over the North Pole (top green circle), while it was 32.7°C or 90.8°F at a location close to where the Mackenzie River flows into the Arctic Ocean (bottom green circle).

Arctic sea ice is in a very bad shape, as also illustrated by the Naval Research Laboratory nowcast below.


Sea ice thickness has fallen dramatically over the years, especially the ice that was more than 2.5 m thick. The image below compares the Arctic sea ice thickness (in m) on July 15, for the years from 2012 (left panel) to 2015 (right panel), using Naval Research Laboratory images.

[ Click on image to enlarge ]
The image below shows sea surface temperature anomalies from 1961-1990 on July 24, 2016.


Sea surface temperatures off the coast of America are high and much of this ocean heat will be carried by the Gulf Stream toward the Arctic Ocean over the next few months.


On July 24, 2016, sea surface temperature near Florida was as high as 33.2°C or 91.7°F, an anomaly of 3.7°C or 6.6°F from 1981-2011 (bottom green circle), while sea surface temperature near Svalbard was as high as 17.3°C or 63.2°F, an anomaly of 12.6°C or 22.8°F from 1981-2011 (top green circle).

A cold freshwater (i.e. low salinity) lid sits on top of the ocean and this lid is fed by precipitation (rain, hail, snow, etc.), melting sea ice (and icebergs) and water running off the land (from rivers and melting glaciers on land). This lid reduces heat transfer from ocean to atmosphere, and thus contributes to a warmer North Atlantic where huge amounts of heat are now carried underneath this lid toward the Arctic Ocean. The danger is that more ocean heat arriving in the Arctic Ocean will destabilize clathrates at the seafloor and result in huge methane eruptions, as discussed in earlier posts such as this one.

As temperatures keep rising, snow and ice in the Arctic will decline. This could result in some 1.6°C or 2.88°F of warming due to albedo changes (i.e. due to decline both of Arctic sea ice and of snow and ice cover on land). Additionally, some 1.1°C or 2°F of warming could result from methane releases from clathrates at the seafloor of the world's oceans. As discussed in an earlier post, this could eventuate as part of a rise from pre-industrial levels of as much as 10°C or 18°F, by the year 2026.

[ click on image to enlarge ]


The impact of rising temperatures will be felt firstly and most strongly in the Arctic, where global warming is accelerating due to numerous feedbacks that can act as self-reinforcing cycles.

Already now, this is sparking wildfires across the Arctic.

Above image shows wildfires (indicated by the red dots) in Alaska and north Canada, on July 15, 2016.

The image on the right shows smoke arising from wildfires on Siberia. The image below shows that, on July 18, 2016, levels of carbon monoxide (CO) over Siberia were as high as 32318 ppb, and in an area with carbon dioxide (CO2) levels as low as 345 ppm, CO2 reached levels as high as 650 ppm on that day.

[ click on images to enlarge them ]
The image below shows the extent of smoke from wildfires in Siberia on July 23, 2016.


The image below shows high methane levels over Siberia on July 19, 2016.


The image below, from the MetOp satellite, shows high methane levels over Siberia on July 21, 2016.

Below are further images depicting mean global methane levels, from 1980-2016 (left) and 2012-2016 (right).

The image below shows methane levels at Barrow, Alaska.


The image below shows that, while methane levels may appear to have remained stable over the past year when taking measurements at ground level, at higher altitudes they have risen strongly.


The conversion table below shows the altitude equivalents in feet, m and mb.
57016 feet44690 feet36850 feet30570 feet25544 feet19820 feet14385 feet 8368 feet1916 feet
17378 m13621 m11232 m 9318 m 7786 m 6041 m 4384 m 2551 m 584 m
 74 mb 147 mb 218 mb 293 mb 367 mb 469 mb 586 mb 742 mb 945 mb

The situation is dire and calls for comprehensive and effective action, as described at the Climate Plan.